

纳米高光谱显微成像技术在高通量的药物研发、递送及质控领域的应用
2022-06-28 来源:知乎 点击次数:2108Coupling Chemical Analysis to High Resolution Microscopy for Enhanced Physicochemical Characterization of Drug Products Containing Nanomaterials and Other Complex Formulations
Sheetal D’Mello, Mamta Kapoor, Katherine Tyner, Sau (Larry) Lee
Office of Pharmaceutical Quality, Center for Drug Evaluation and Research,
Food and Drug Administration, Silver Spring, MD 20993
在提交给FDA的申请中,含有纳米材料的药物产品越来越引人注目。这些新药中有许多是单相或多相体系中含有颗粒的复合剂型。通常,产品的实际微观结构是未知的。随着产品数量的增加,如何恰当地定义和描述这些配方的关键质量属性也是一个问题。通过光散射或成像分析药物的粒度分布(这类产品的常见特征)很少能够提供有关药物的化学微观结构的信息(例如,活性药物成分(API)的位置)。从质量控制的角度来看,随着配方复杂性的增加,这些信息变得更加重要。因此,我们的工作重点是利用纳米高光谱显微镜定量评价复杂药物制剂中的颗粒大小分布,获得药物产品的整体微观结构信息。
纳米高光谱显微成像系统可以观察复杂配方中纳米尺度域的多分散性,为DLS的测量结果提供了补充。
运用CytoViva®显微镜综合配方,不同大小的数量被确定(类似于DLS直方图),但图像分析进一步能够区分聚集,这在其他技术中是不可能实现的。
该方法通过建立参比材料的光谱库,实现了水包油乳液中纳米尺度结构域的识别和映射。
我们能够对多相制剂中的液体微环境进行区分和鉴别,并识别药物产品中原料药的分布。
我们还能够光学和光谱分析其他复杂的环境,如奶油。
本报告演示了使用这种成像技术在复杂微观结构中建立API位置的概念验证数据。
进一步的工作包括方法验证和技术鲁棒性评价。
通过将化学信息与高分辨率成像技术产生的形态学信息耦合起来,我们可以通过获取制剂微观结构的关键信息,重新定义成像方法在复杂药物产品表征中的作用,否则无法获得这些信息。
确定用于质量控制和理化表征的成像参数将支持纳米技术研究和复杂药物产品开发。
此外,该项目将为验证复杂产品的成像方法时的稳健性研究提供一个框架。
最后,将讨论有关感兴趣的复杂配方的形态学的具体问题,并将代表我们理解复杂微观结构能力的提高
该技术发展成为一个FDA批准APIs(活性药物成分)的有效工具,用于表征纳米或微米级的载体靶向给药、药物毒性等。同时该技术它也广泛地应用到成像和表征用于光热治疗及相关诊疗的研究中,比如纳米毒理学和其他通用型纳米材料的合成开发。目前美国FDA拥有五台CytoViva系统,2019年又将有一台新系统投入使用。
原文:
Outlined below are some example hyperspectral images and associated data from a RESTASIS® sample. This data was captured separately from the FDA work but is illustrative of the ability to capture hyperspectral images and conduct image analysis as well as identify and spectrally map the API within the emulsion vector.
Outlined below are some example hyperspectral images and associated data from a RESTASIS® sample. This data was captured separately from the FDA work but is illustrative of the ability to capture hyperspectral images and conduct image analysis as well as identify and spectrally map the API within the emulsion vector.
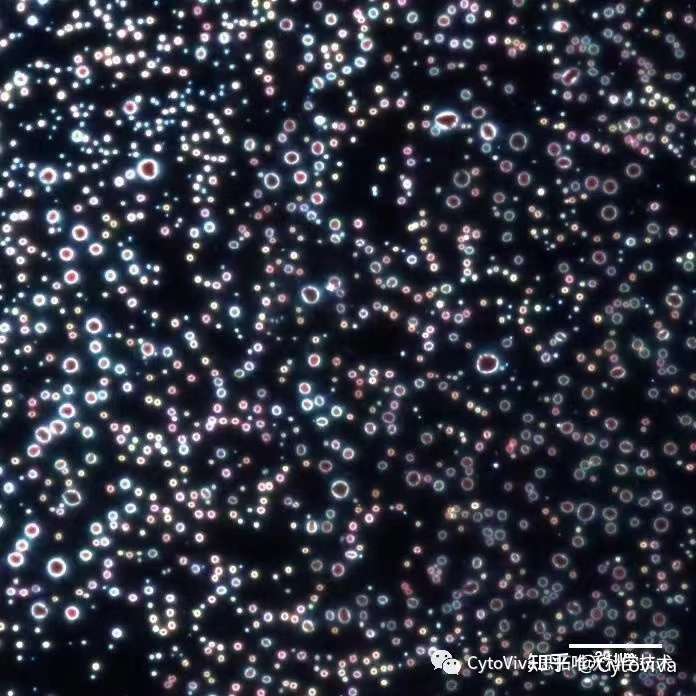
Figure 4: 60x Hyperspectral Image of RESTASIS Sample.
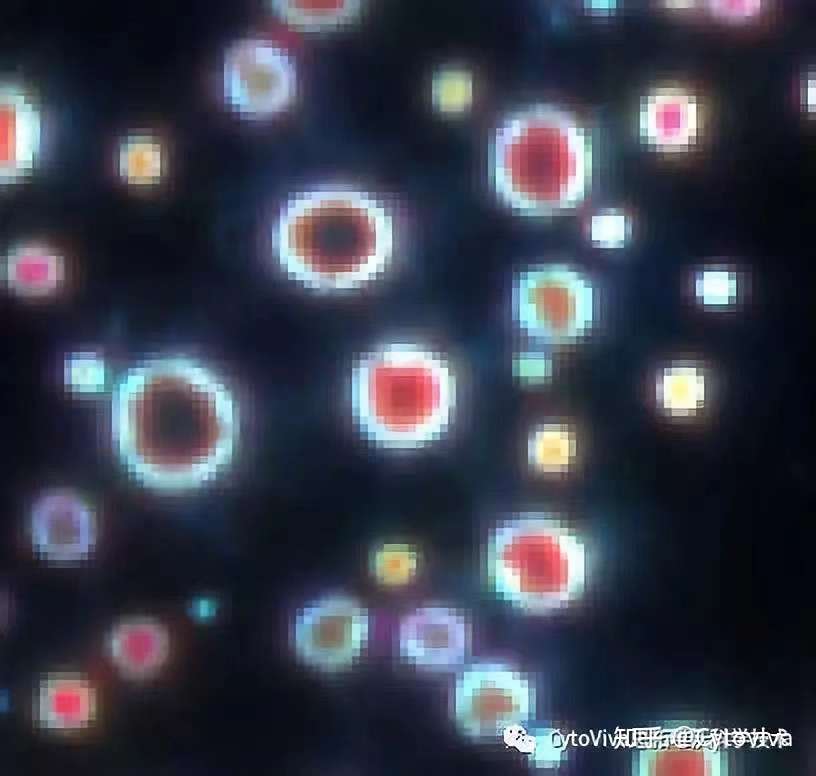
Figure 5: 4X Digital Zoom Hyperspectral Image.
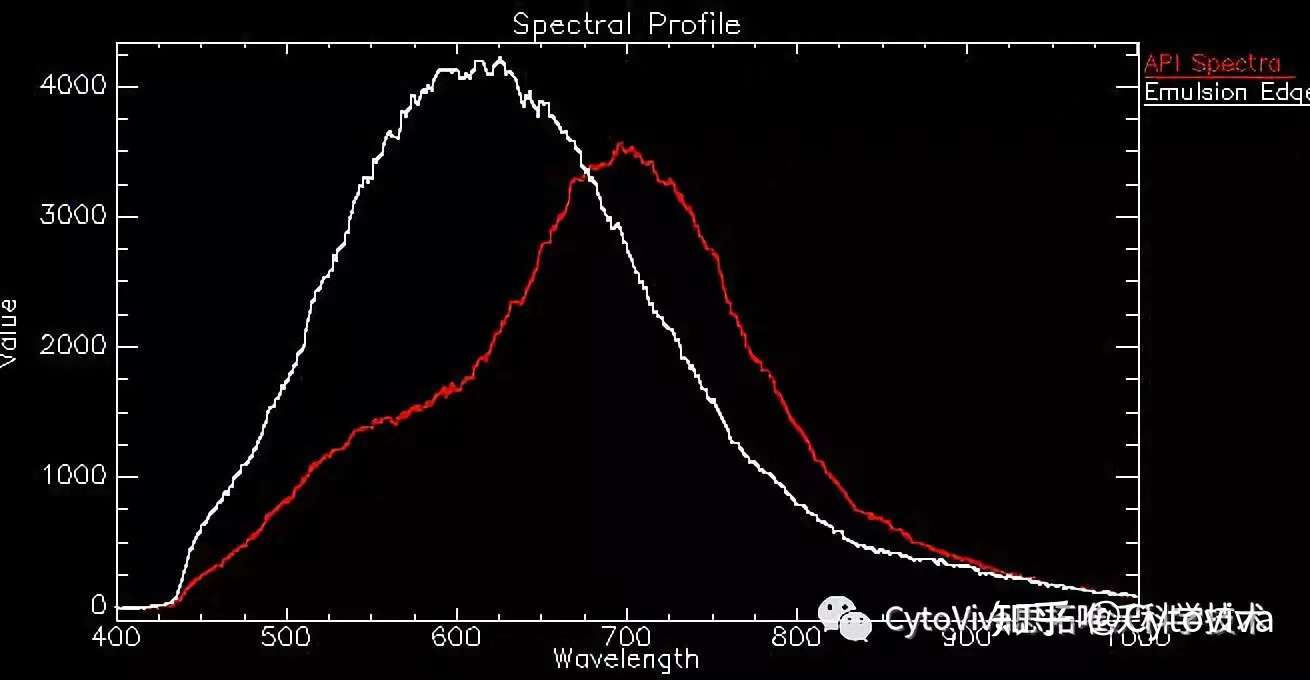
Figure 6: Example Spectrum of the API (red) and Emulsion (white).
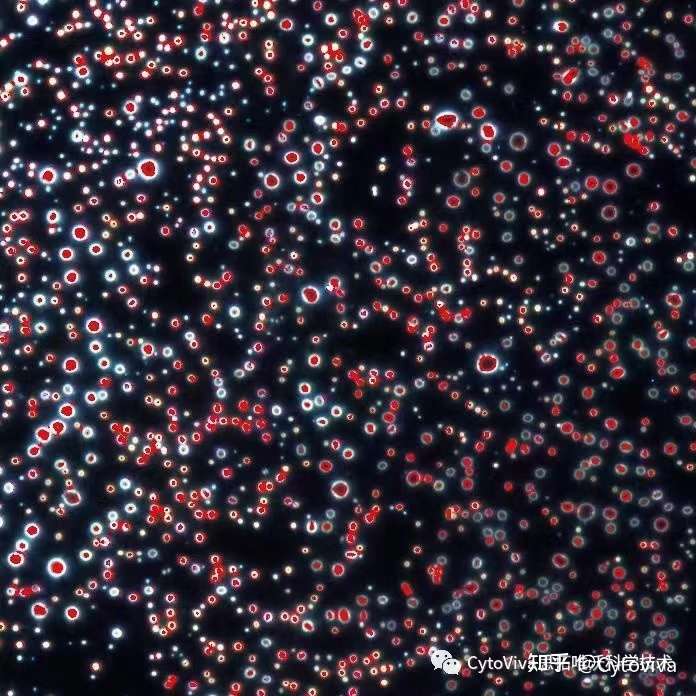
Figure 7: Spectral Mapping of the API Spectra Throughout the Entire Image. Note That Most Mapping of the API Occurs Inside of the Emulsion.
In Figure 6 above, example spectrum from pixel areas of the emulsion chemistry and API are illustrated. There is a distinct red-shift of the API spectrum, which is ~100 nm difference at the peak wavelength versus that of the emulsion edge spectrum. Based on this difference, a spectral library of the API spectrum is created and tested against a negative control and is then used to conduct spectral mapping of all pixels matching the spectrum of the API in the image shown in Figure 7.
CytoViva是由美国Auburn大学与Aetos技术有限公司合作成立,具有高校和军事公司背景,CytoViva纳米高光谱成像技术最初是由美国国防部和美国宇航局空间卫星航空成像开发的技术发展而来,该公司创造性的将该技术与增强型暗场技术结合并应用于微观层面,使其成为一个专有、集成的系统,能够在纳米尺度上对材料、药物、生命单元、活性大分子、环境污染物等进行高光谱成像及定性定量分析。
CytoViva纳米高光谱成像技术2005年一经面市,就在2006年和2007年连续两届获得著名的R&D100大奖,07年同年获得Nano50TM奖,在09年获得了两项美国专利,专利号7542203和7564623,并迅速得到全球各个国家重点实验室、科研机构及大型制药企业的认可,包括FDA, NASA, NIST, NIH, EPA, USDA, NIOSH, Lawrence Berkeley Labs, Dow Chemical,Merck, Johnson& Johnson, Stanford, Duke, Harvard等等。
The application above is just one of many successful examples of drug delivery vector analysis that has been conducted utilizing CytoViva’s enhanced darkfield hyperspectral microscopy system to provide visual spatial and spectral context concerning the interaction between an API and its delivery vector.
Finally, CytoViva’s enhanced nano-scale hyperspectral imaging has recently been integrated with full-featured Raman imaging on the same microscope platform. This enables cross-correlation between the two techniques of an identical area of a sample. More information regarding this integration of fully featured Raman and broadband hyperspectral microscopy will be outlined in a separate white paper.